Urea Leads Majority of Fertilizer Prices Lower
For the second week in a row, most fertilizer prices were lower than the previous month. The only fertilizer with a significant move in either direction was urea. The nitrogen fertilizer was 5% lower compared to last month with an average price of $556 per ton.
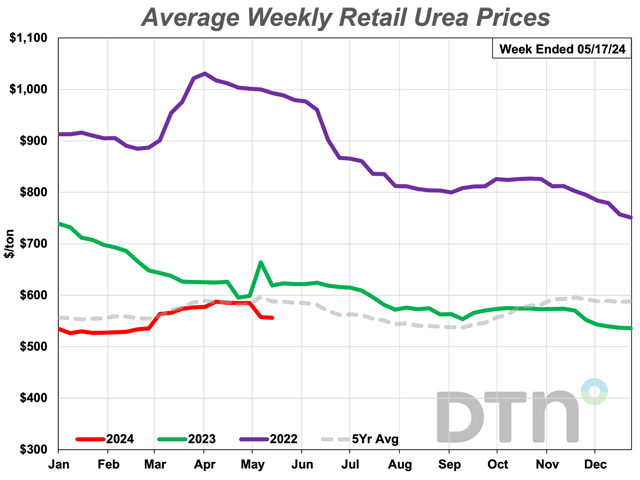
OMAHA (DTN) — Average retail prices for most fertilizers were lower during the second week of May 2024, according to sellers surveyed by DTN. This was the second week in a row that most fertilizer prices were lower.
Also, like last week, the price of just one fertilizer saw a significant move, which DTN designates as anything 5% or more. That was the price of urea, which was down 5% from a month ago. The nitrogen fertilizer had an average price of $556 per ton.
Prices of four other fertilizers were just slightly less expensive compared to last month. MAP had an average price of $829 per ton, potash $511/ton, anhydrous $792/ton and UAN28 $364/ton.
Three fertilizers were slightly higher in price from last month. DAP had an average price of $789/ton, 10-34-0 $642/ton and UAN32 $418/ton.
On a price per pound of nitrogen basis, the average urea price was $0.60/lb.N, anhydrous $0.48/lb.N, UAN28 $0.65/lb.N and UAN32 $0.65/lb.N.
In a post titled “Are You Overspending on Fertilizer?” University of Minnesota Extension educator Brad Carlson examined the farm financial data from thousands of farmers in the Minnesota farm business management program (https://blog-crop-news.extension.umn.edu/2024/04/are-you-overspending-on-fertilizer.html). Carlson said he looked at the fertilizer expense on a per-acre basis in the database to see if farmers were overspending on fertilizer.
Carlson discovered that in 2016, fertilizer costs for the 20% most-profitable farms averaged $138 per acre, while the 20% least-profitable farms spent $177 per acre on fertilizer — a 28% difference.
“I have continued to track the reports annually, and the results have been relatively consistent over the years, with the least-profitable farms between 2017 and 2022 spending 15% to 30% more on fertilizer per year than the most profitable farms,” Carlson wrote. “For comparison, the difference in seed cost averaged 0.5% to 12% more per year.”
There were six main reasons why farmers overspent on fertilizer, according to Carlson. Those included putting on too much nitrogen, increasing nitrogen rate to mask bad application choices, applying phosphorus and potash when removal rates are already high, split-applying nitrogen when there is no advantage, using premium fertilizer products, and buying a fertility advisory technology that doesn’t pay for itself.
Once again, all fertilizers are lower compared to one year ago. MAP is 1% lower, DAP is 5% less expensive, anhydrous is 12% lower, 10-34-0 is 13% less expensive, UAN28 is 14% lower, urea is 18% less expensive and both potash and UAN32 are now 19% lower compared to a year prior.
DTN gathers fertilizer price bids from agriculture retailers each week to compile the DTN Fertilizer Index. DTN first began reporting data in November 2008.
In addition to national averages, MyDTN subscribers can access the full DTN Fertilizer Index, which includes state averages, here: https://www.mydtn.com/agriculture/web/ag/markets/fuels-fertilizers#!/fertilizers.
Fertilizer manufacturer Mosaic said lower fertilizer prices led to a 26% drop in quarterly sales for the company to $2.7 billion, according to Dow Jones. You can read about it here: https://www.dtnpf.com/agriculture/web/ag/crops/article/2024/05/15/retail-fertilizer-prices-mixed-lower.
| DRY | ||||
| Date Range | DAP | MAP | POTASH | UREA |
| May 15-19 2023 | 829 | 831 | 627 | 619 |
| June 12-16 2023 | 823 | 832 | 621 | 624 |
| July 10-14 2023 | 811 | 823 | 614 | 609 |
| Aug 7-Aug 11 2023 | 758 | 764 | 566 | 576 |
| Sep 4-8 2023 | 738 | 745 | 518 | 563 |
| Oct 2-6 2023 | 705 | 791 | 508 | 573 |
| Oct 30-Nov 3 2023 | 713 | 801 | 508 | 573 |
| Nov 27-Dec 1 2023 | 715 | 820 | 518 | 552 |
| Dec 25-29 2023 | 721 | 812 | 514 | 536 |
| Jan 22-26 2024 | 734 | 809 | 509 | 527 |
| Feb 19-23 2024 | 749 | 812 | 506 | 534 |
| Mar 18-22 2024 | 778 | 823 | 506 | 574 |
| Apr 15-19 2024 | 780 | 830 | 513 | 585 |
| May 13-17 2019 | 789 | 829 | 511 | 556 |
| LIQUID | ||||
| Date Range | 10-34-0 | ANHYD | UAN28 | UAN32 |
| May 15-19 2023 | 739 | 895 | 421 | 514 |
| June 12-16 2023 | 737 | 781 | 406 | 476 |
| July 10-14 2023 | 730 | 734 | 393 | 465 |
| Aug 7-Aug 11 2023 | 714 | 634 | 369 | 400 |
| Sep 4-8 2023 | 611 | 693 | 356 | 390 |
| Oct 2-6 2023 | 609 | 790 | 354 | 414 |
| Oct 30-Nov 3 2023 | 611 | 826 | 358 | 415 |
| Nov 27-Dec 1 2023 | 595 | 847 | 341 | 409 |
| Dec 25-29 2023 | 599 | 792 | 340 | 394 |
| Jan 22-26 2024 | 610 | 770 | 335 | 390 |
| Feb 19-23 2024 | 615 | 764 | 339 | 393 |
| Mar 18-22 2024 | 628 | 793 | 358 | 402 |
| Apr 15-19 2024 | 641 | 794 | 364 | 418 |
| May 13-17 2019 | 642 | 792 | 364 | 418 |
Russ Quinn can be reached at Russ.Quinn@dtn.com.
Follow him on social platform X @RussQuinnDTN.