Gulke: Is There Enough Storage?
The views expressed are those of the individual author and not necessarily those of DTN, its management or employees.
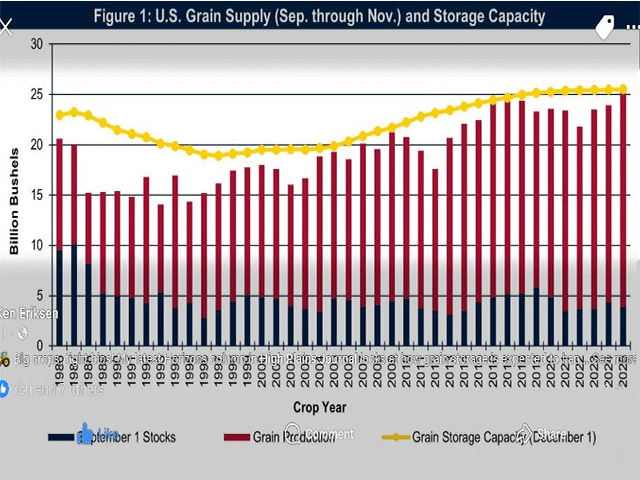
[This chart illustrates U.S. Grain Supply vs. Storage Capacity. The yellow line is storage capacity of all grains, the red bar is total production, and the blue bar represents Sept. 1 ending stocks. (Source: USDA NASS and the Gulke Group)]
When listening to the media or watching analysts on TV, the focus seems to have turned from a record crop to how we are going to store all that corn and soybeans. If I didn’t know better, I would think those who are trying to develop some sort of pseudo-outlook were trying their best to talk down prices, focusing now on a lack of storage.
I think this may be more of a wishful thinking scenario, as the negative bias of the potentially record crops has corn and soybeans finding more support that most would like to see based on their bottom-is-not-in-scenario. Misery loves company, and certainly those finding themselves over-hedged or oversold in cash need a bearishly construed report to save face. So, the lack of any more bearish news that the market bought on Aug. 12 has shifted the focus to the fear of insufficient storage. I guess fear sells, but perhaps you’ll find some good news in this week’s column.
Shortly after the June 30 stocks in all positions report, I mentioned that there was about 40% less of 2025 corn on farm than last year. I suggested less down pressure on prices in late August and the opposite for corn as compared to last year. Farmers learned a lesson last year that they weren’t going to repeat. Besides, July corn futures were trading at a 37-cent premium to December. Why hold for cheaper prices?
A little research brought to light the historical U.S. Grain Supply vs. Storage Capacity (see the chart accompanying this column — source USDA NASS and the Gulke Group). The yellow line represents storage capacity for all grains, the red bar is total production, and the blue bar represents ending stocks. Data is for the first quarter of the marketing year, September through November.
Last year’s data indeed showed that from the beginning of last fall, there was barely enough storage. In fact, storage was the tightest it had been since 2019. Thus, the continued news of a lack of farmer selling that caused the capitulation by Aug. 28, 2024. Not so this year. Storage may very well be tight again depending on the crop, but suffice it to say, it is not as tight as the media pundits would have you believe.
You will recall that I stated many times in the last year that USDA was overstating the carryout, projecting 2.1 billion bushels (bb) for 2024-25 ending stocks when, in fact, the final number was 1.236 bb, or nearly 900 million bushels (mb) more projected a year ago when the bar for 2025 crop year was printed. It’s no wonder the media hype was again saying on-farm stocks have to come to market. (See last week’s column.)
Simple math should suffice, but plainly stated, the blue bar in the accompanying chart should be shorter. Considering the huge futures carry in the market for corn, the incentive is there to store wherever. Given the ridiculous charges to store grain commercially, those who have to sell excess unsold product off the combine may think about leveling off corn stalks and piling it on the ground. My recent calculations to store in northern Illinois to March 1 will cost me about 33 cents more than the cash carry in the market, as buyers have a way of widening basis.
If there is rationale to believe USDA will reduce its corn yield estimate by 2 bushels per acre on Friday, that takes another 200 mb off ending stocks, all things staying equal on the demand side. Before you drink the “lack of storage Kool-Aid,” consider the source(s). No doubt, there will be some surprises on Friday.
Jerry Gulke can be reached at (707) 365-0601 or by email at Jerry@gulkegroup.com
(c) Copyright 2025 DTN, LLC. All rights reserved.