Gulke: Post-Thanksgiving Trade
The views expressed are those of the individual author and not necessarily those of DTN, its management or employees.
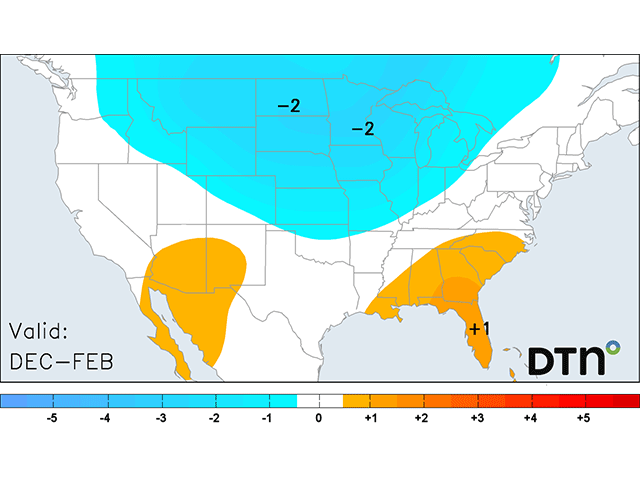
Frequent cold is forecast across the northern half of the country this winter, though widespread cold influences should occur early in the season. (DTN graphic)
A point of importance I learned years ago was that post-Thanksgiving trading can exhibit a change in direction. The obvious reasons include that harvest is complete and that the November WASDE pretty much reflected known information regarding supply and demand, suggesting all the known information has already been reflected and discounted in price. It is the not-so-obvious information that needs attention.
Conventional wisdom for most traders is that the continuous contract reflects the most important demand side of the equation, where most of the business is reflected or priced. Other contracts reflect carry charges/benefits for later delivery. In the case of corn, December is the lead contract until December is no longer valid and March becomes the lead (demand-reflected) contract. Further conventional ideas include monitoring the December futures contract until it goes off the board around Dec. 15. That may be conventional, but it lacks wisdom and common sense in my book.
Trading is all but nonexistent after first notice day, so where is the wisdom in monitoring December in this case to give December futures any respect? It is March that most bids are already referencing. First notice day is Friday, whereupon if one was long December futures, there is a chance to get corn delivered on that contract; thus, trading December is folly. This is where the wisdom of conventionalism fails to make sense and common sense prevails.
As of next Monday morning, March futures will take on importance. Visualize, if you will, what a price 15 cents higher than December, which vanishes in importance on Friday, will do for a continuous price chart. The chart accompanying this week’s column reflects just that case, going back to September 2024 and 2025 with gaps higher on a daily and weekly basis. It threatens to do so again, as March is trading at $4.18, which just happens to be the high last week on the continuous chart, as I see it.
Corn gapped higher in 2024, where I suggested that most brokers wouldn’t recognize a bull market if they saw it walking down the street. It wasn’t until corn peaked on Feb. 21, 2025, that media types finally recognized the trend, and the top was in for the year.
In September 2025, similar action was seen this fall, whereupon it was noted in the media by “technicians” that the gap in September would get tested and filled, while you read in this column that the harvest lows were in place.
So, here we are again with an up-gap to contend with, as March is trading at $4.38 with two days left to trade to see if we can get March to close higher than $4.38 to facilitate that gap on Monday. Interestingly, March closed 1 1/2 cents higher, while December closed 1/4 cent lower, widening the spread!
Coincidentally, the continuous chart shows some more interesting facts. The red line (52-week average) lies at last week’s highs. If you look carefully at the first trading week of December 2024, it coincidentally gapped higher than the 52-week average. Coincidence or price discovery?
You will recall that in a previous column this month, I wrote about the rare occurrence of being able to buy/sell very low-cost options as a risk management tool(s). Taking profits first on long cheap calls the morning before the November WASDE report enabled purchasing cheap put options at the same time, basically reversing risk management, as the trade was leaning bullish markets. The puts were later exercised into short futures, which in turn will be exited on Wednesday ahead of the first notice day and for reasons discussed above.
It has been against my DNA for years to purchase put or call options, as they usually expire worthless. But on rare occasions, one can catch the market makers napping in favor of low volatility and price to where they work. In this case, it was a lack of information from the USDA shutdown that created the opportunity. The red bars on the bottom of the chart depict the net position of the large spec that is woefully behind reporting and likely will provide a surprise when catch-up is complete.
So far, USDA has been very slow in catching up with past data, which is basically useless now and keeps the media guessing while price discovery goes on, providing nonconventional wisdom above.
There are also high odds that the trade outlook emerging now will be expecting a repeat of a bull market going forward. There is a difference, however. Last year, this column repeatedly called attention to NASS/WASDE overestimating ending stock, and the result was a 700-million-bushel reduction until WASDE “found” 200 million bushels on Sept. 30, 2025. This year, USDA has extrapolated increasing demand proactively to neutralize the supply/demand. Jan. 12, 2026, could be very shocking when USDA reconciles all the data it does not yet know!
Jerry Gulke can be reached at (707) 365-0601 or by email at Jerry@gulkegroup.com
(c) Copyright 2025 DTN, LLC. All rights reserved.