Gulke: USDA March Report Implications
The views expressed are those of the individual author and not necessarily those of DTN, its management or employees.
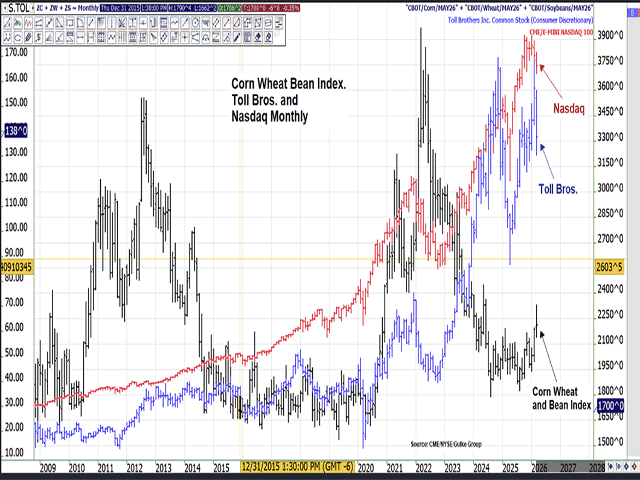
This chart depicts the relationship between the NASDAQ stock index, Toll Brothers housing stock (an important indicator, as well), and Jerry Gulke’s personal index of corn, soybeans and wheat. The 25-year history speaks volumes. (Chart by Gulke Group)
Various commodities responded in different manners on Tuesday to USDA’s Prospective Plantings and quarterly Grain Stocks reports, and rightly so. As expected from our Gulke research and private acreage survey, corn acres weren’t reduced as much as the trade or the Ag Outlook Forum had estimated. Nor were soybean acres increased as much. Our firm’s data did not reflect anxiety the trade had about the implications of increasing fertilizer costs on planting intentions.
The media was intent on believing there would be an obvious impact on planted acreages. But since the farmer survey was carried out in the first two weeks of March, perhaps any effect was muted. It was rumored on social media that phone calls were made to survey participants as late as last Friday to update any changes, but that was not formally stated in the Prospective Plantings report. Our re-survey showed little effect, as well.
Also of interest was the stocks in all positions report showing on- and off-farm stocks as of March 1, 2026. Corn stocks on farm increased over last year, by 21%, while soybean on-farm stocks were up only 3%. However, the extreme price volatility during the first two weeks of March was said to have seen significant commodities — especially corn — move to market, with long lines at elevators reported. Some end-user facilities also said they had purchased needs for the next few months, meaning on-farm stocks likely were reduced after March 1. Therefore, the negative price reaction on Tuesday was tempered somewhat on Wednesday as analysts dug into the numbers.
Using the Ag Outlook Forum’s 2026-27 demand estimates and plugging in the new acreage numbers, the results explain why new-crop soybeans led the price increase, while corn was subdued. Ending stocks for 2026-27 extrapolate to under 350 million bushels (mb), or about 10 mb less than last year, even while holding yield again at last year’s record 53 bushels per acre (bpa). A 1-bpa reduction in yield means about 83 mb less production. Getting back to a more normalized yield of 51 bpa of years past, and ending stocks drop to under 200 mb, and that barely supplies the pipeline!
Corn, on the other hand, is more sensitive to acres than yield, as 1 million acres is equal to about 183 mb, more or less. If a million fewer acres are planted, carryover drops to 1.924 billion bushels (bb), using the Outlook Forum’s yield of 183 bpa. That’s still adequate, but yields or acres can’t drop much further for corn, and this is only April, with growing weather and fertilizer availability still on the table.
The bottom line suggests that more volatility is ahead and is subject to government action, pro or con, as well as to what kind of agreement evolves out of the April meeting with China, assuming it actually takes place. If it does, it is the agreement that gets finalized that will hold the cards. Rumors suggest that the framework may be a minor image of the Trump I Phase One agreement that included the clause that China would spend money on agriculture products and not be tied to bushels or a particular commodity, unlike the November 2025 framework that included a commitment for bushels of soybeans. What concerns me is that there was also the caveat in Phase One of Trump I that said, “We (China) will buy dollars of grains if we need them and if the U.S. is competitive.” That left the deal wide open to China’s discretion. Something better will be needed with teeth in it this time.
Having said all that, my long-term outlook is still intact, following the paradigm shift that began in September 2024 on how we will do global business in agricultural trade. Further support should come from the increased concerns that importing nations have seen in the importance of energy security. I would think that food security would rise to the top soon. If not now, then when?
Thinking out of the box a little suggests that even our competitors might want to hold a little extra, not to mention all the importers, big or small, that should now realize that adequate food security is perhaps just as — if not more — important than energy, at least in the short run.
The chart accompanying this week’s column is taken from our annual spring outlook conference held earlier this week near Chicago. It depicts the relationship between the NASDAQ stock index, Toll Brothers housing stock (an important indicator, as well), and my personal index of corn, soybeans and wheat. The 25-year history speaks volumes. Which sector or sectors do you think are due for a reset or adjustment?
Jerry Gulke can be reached at (707) 365-0601 or by email at Jerry@gulkegroup.com
(c) Copyright 2026 DTN, LLC. All rights reserved.