Gulke: Ahead of January WASDE
The views expressed are those of the individual author and not necessarily those of DTN, its management or employees.
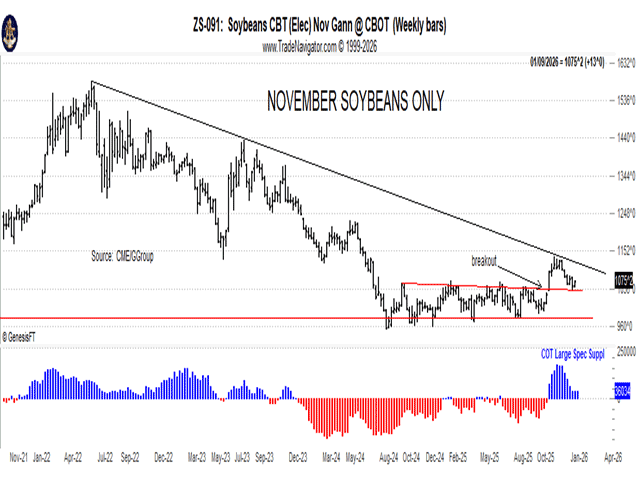
(Chart by Gulke Group)
The Jan. 12 World Agricultural Supply and Demand Estimates (WASDE) report is the time when USDA NASS can reset perception with the current reality. Whether USDA has the staff — or passion — to present after the displacement of 20,000 workers will be a matter of opinion by the data-starved media. But considering professionalism, anything less would be unacceptable — at least it would be in the private sector.
Having said that, I can’t express how important the facts released will be on market direction. Those who believe an average corn yield of 186 bushels per acre is valid are in the minority. Just today, 180 bpa was touted by someone in the industry. I’d be naive to think WASDE would reflect such a revision. Even a 3-bpa drop (270 million bushels) would help ending stocks carryout, but would allow a drop in feed & residual as a neutralizer. It would be dangerous to lower the current lofty corn export estimate, given current loadings (corn leaving our shores), with current stats showing export loadout is 65% ahead of last year. To meet current USDA export estimates, we need to average 60 million bushels (1.5 million metric tons) per week. Remember that as we are moving forward.
On the other hand, soybeans are behind last year by 45% and need to average 31 million bushels per week (844,000 metric tons) to meet estimates. Today’s soybeans showed apprehension for a bearish report and reflecting why we lost $1.40 in old crop and further justification why I have mentioned lights out for beans.
A macro (big picture) outlook on commodities has proven beneficial for me to keep my year-ahead outlook in perspective, using the futures markets as a precursor. Both the corn and soybean charts that depict new-crop CZ and SX only give a good perspective of when a price incentive is needed to expand or reduce acres. Currently, the market seems complacent.
Three Market Phases: Price moves in basically three directions: up, down and sideways. After the rally in 2010-12 to $8, the high price curbed demand and expanded production, as Econ 101 would dictate; anyone can grow $8 corn. Price discovery dictates that we won’t run out of a commodity. In the case of 2010-12, price-rationing of demand, along with supply increasing, resulted.
The oversupply reduced demand, resulting in a low-price sideways trading pattern where additional demand was discovered and/or production was curbed over time. After seven years of base building (building demand), prices rallied during Jan—May 2012 to $7.50 per bushel, sending a signal to producers via December 2012 futures to plant corn. Last year’s incentive ended on Feb. 21. This year, the incentive isn’t there, yet!
The new paradigm shifts I’ve seen coming in the past 18 months are becoming more obvious but have yet to play out. Has this administration reset global ag economics such that the U.S. gets a bigger piece of global demand, regardless of price? Or will the new economics pay a role in finally leveling the playing field and thus competition? The best result would be if a rising tide (U.S.) lifts all global economic consumption. Certainly, the action with Venezuela represents such potential and sends a signal that old relationships are a thing of the past.
Your worst nightmare next Monday would be if you are a bullish producer holding old crop and WASDE does not lower yield(s) but somehow raises carryovers for either or both corn and soybeans. If you are negative tariffs and anything Trump-related, including China buying soybeans to fill the 25-mmt commitment, your worst nightmare is if, one morning, you wake up to a flash sale announcement relating to the 2026-27 crop.
I have related in past months’ columns that sometimes the market media gurus get confused, especially when starved for some data to relate and opportunities reveal themselves. A lack of such market confusion leads to a lack of desire to participate and, thus, opportunity. Cheap option protection for both bulls and bears can become available. If your broker can’t think out of the box, give me a call; perhaps I can help. The chart accompanying this week’s column shows November soybean futures over time and illustrates what is at stake. The blue/red graph reflects the net large spec positions pre, during and post China framework discussions and China’s reaction hence; it’s worth a thousand words.
Jerry Gulke can be reached at (707) 365-0601 or by email at Jerry@gulkegroup.com
(c) Copyright 2026 DTN, LLC. All rights reserved.