Gulke: WASDE Implications
The views expressed are those of the individual author and not necessarily those of DTN, its management or employees.
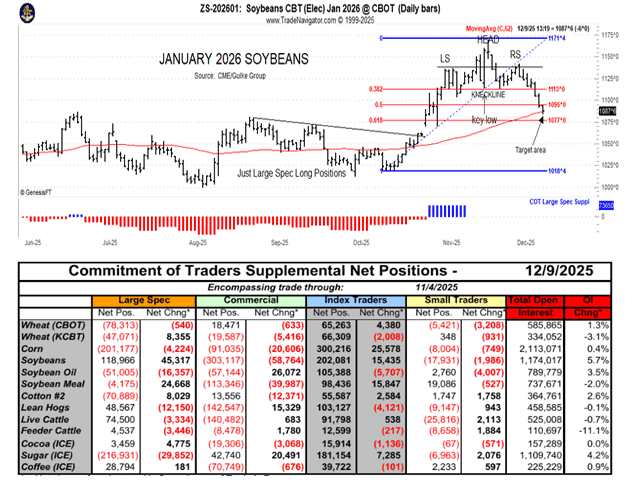
The red/blue graph at the bottom of the top chart is an update of the CFTC large spec net position, with red negative and blue net long. The graph shows the spec was exiting short positions before the China-U.S. trade talks and was net long when prices gapped higher and then enjoyed the ride to the top. (Charts by Gulke Group)
SHORT, MEDIUM-LONG OUTLOOK: A few weeks/months ago, I considered short-, medium- and long-term outlooks for grains that I grow and for those with whom I consult on marketing and risk management.
I concluded and wrote in this column that harvest lows were made early — about Sept. 1 — with the focus then on exiting hedges and focusing on rallies in futures in the short-term during harvest and what to do with unsold/unhedged grains while maintaining a positive bias in the medium and long term. All this time, media hype has been focusing on the terrible plight of the farmer and the need for money to bridge the gap between a negative profitability outlook and the time that production ag would benefit from administration acts. There had been no lack of opportunities to profit from price swings during the year, but flexibility in managing price risk going forward was a must.
SHORT TERM: With harvest basically over and hedges lifted, unsold crops in bins of those who have on-farm storage and forward sales delivered off-combine with basis contracts. Basis contracts were held until forced to sell due to time, then a medium-term outlook evolved.
MEDIUM TERM: Harvest lows were in, and odds favored a post-harvest rally. The subsequent $1.40-per-bushel rally in soybeans was partially gleaned from long calls. Soybeans in on-farm storage were held in place. Tariff talks ensued in late October, with the top in beans coming one day after a very large purchase of soybeans on Nov. 17. The first sell signal came quickly two weeks after the China-U.S. deal framework meeting and came before the proverbial head-and-shoulders bearish formation signaled trade was getting anxious. Markets act and react quickly to evolving circumstances, leaving little time to react to get 90% of the 2025 crop priced. The rest is history, as the price reacted quickly to retrace 50% of the whole gain.
LONG TERM: The WASDE report on Tuesday gave more information from a longer-term perspective, especially in corn. Corn didn’t get nearly the publicity as soybeans did in the past few weeks of the “China deal.” And the actual purchasing and shipment of the 12 million metric tons of proverbial buying of soybeans by China has slipped out into a “season” of purchases, leading the trade to believe it will be a long, drawn-out process. In the meantime, bridge funding from now until better times are here was announced, further suggesting more time is on the table before agriculture trade results will make ag better again. There is light at the end of the tunnel for corn.
USDA increased corn exports again to new record highs, which lends credence to my earlier thoughts that tariff implications suggested there are three more years of the Trump administration to see tariffs affect U.S. demand for corn and other ag items. By increasing exports, it provided a cushion should the next WASDEs see a need to reduce large feed and residual estimates. Perhaps it is seen that Mexico will need even more corn to feed land-locked feeders, provided we can ship it.
The excellent demand opens the possibility that in the Jan. 12, 2026, final WASDE report, USDA will finally have to succumb to lower corn yields. This possibility has got to be on the minds of traders in the last half of December. Ahead of Tuesday’s report, the market again provided some rare opportunities to manage both upside and downside risk, as the December WASDE can be fickle. Buying at-the-money January call and put options for about 4-5 cents and selling a March $4.50 call as an offset looked safe. Once the report was out and the bearish outlook diminished, the put option was sold at a slight loss, while holding an upside call spread. The 90% position sold in soybeans so far has worked, but with soybeans at near-50% retracement of gain and near the 50-day average, short-covering could happen and hopefully give new-crop 2026 another chance at $11.50 again, where adding to coverage would look attractive. With input costs exploding, I’ll look for any excuse to grow soybeans rather than corn. It will likely be the low-cost producer that will have an edge this year.
The January soybean chart accompanying this column is a pictorial representation of the timelines mentioned above the best I could depict them. The actions taken do not involve rocket science but instead some plain common sense. The red/blue graph at the bottom of the top chart is an update of the CFTC large spec net position, with red negative and blue net long. The graph shows the spec was exiting short positions before the China-U.S. talks and was net long when prices gapped higher and then enjoyed the ride to the top. With data a month old, we will likely find out the large spec has been dumping longs, starting about the same time as technical signals warned.
The question remains: Will support come at Tuesday’s testing of the 50-day average (red line) or look to fill the gap? Let’s hope the former happens. At 90% sold, I am not sure if I care — my concern now rests with corn and new-crop soybean prices.
Jerry Gulke can be reached at (707) 365-0601 or by email at Jerry@gulkegroup.com
(c) Copyright 2025 DTN, LLC. All rights reserved.