Gulke: Corn vs. Crude
The views expressed are those of the individual author and not necessarily those of DTN, its management or employees.
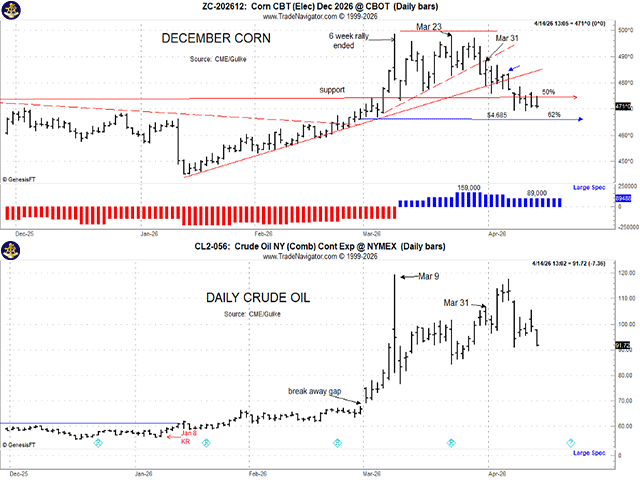
These price charts compare new-crop corn and crude oil and show that the relationship between the two that some have been claiming may be due more to a lack of due diligence. (Chart by Gulke Group)
From what I have heard and seen in the media, recent price discovery for what we grow to sell has been totally influenced by crude oil, which in turn has been influenced by the war in Iran. I would beg to differ. The price charts accompanying this week’s column, which compare new-crop corn and crude oil, would suggest that such a relationship may be due more to a lack of due diligence than to reality. For example:
— Crude oil and December corn futures peaked on March 9, with the corn bullish market peaking about six weeks after the Jan. 13 post-WASDE low. About six weeks is typically long enough for grain markets to digest new news. This is where the correlation ends, in my opinion.
— Crude oil fell about $38 per barrel to the proverbial 61.2% of the total move up from the gap area on March 3 to the top on the 9th, doing so on March 23.
— During crude oil’s 10-day retraction, corn tried to rally to challenge the March 9 high on March 23 but failed, posting a massive daily key reversal down just as crude was posting its 61.8% retracement low.
— Coincidentally, December corn posted its first sell signal — using our company analysis — since the buy signal on Jan. 23, shortly after the January low.
— Furthermore, December corn continued lower, breaking a steep uptrend (dotted line) the day before the acreage report was released on March 30. And then December corn followed the more rational 45-degree angle uptrend on the 7th, posting another minor key reversal lower. It closed on Tuesday within a nickel of a full retracement, wiping out the whole gain supposedly due to the war.
— All the while, crude rallied again to challenge the $120 area, only to fail.
— Our Gulke Group analysis did not put a lot of media attention on the idea of a direct correlation between crude and corn — or soybeans, for that matter — and acted accordingly. In fact, during the war hype, the large spec reduced his net-long position in corn by 70,000 contracts (nearly 50%) and soybeans by 24,000 contracts, all in one week.
CORN VERSUS SOYBEANS. During the above volatility in corn, as compared to soybeans, the difference in my spreadsheet in gross income before land and overhead between corn and soybeans widened another $50 per acre in favor of soybeans. Recent anecdotal information suggests that those who did not purchase fertilizers and other inputs in advance are now gravitating to soybeans at the last minute.
WHAT THE MARKET WANTS. The market likes to see a situation where we plant too much of everything to neutralize supply and demand. According to the April WASDE, corn carryover at 2.062 billion bushels (183 bushels per acre with 95.3 million planted acres) is still too much, and the market has reacted accordingly, disfavoring corn in favor of soybean planted acres. The same WASDE suggests 84.7 million planted acres of soybeans at 53 bpa will result in 341 million bushels of ending stocks — perhaps not enough, considering pipeline supplies and China, if they would buy 8 million metric tons (mmt) plus the other 25 mmt.
WHAT WILL IT TAKE? The secretary of agriculture suggests 20% of producers — of what size, who knows — had not priced inputs before the explosion in prices. I assume she means harvested corn acreage of about 17 million acres may be affected. Thinking out of the box on that production, one could get wildly bullish corn if 20% of that 20% who are unpriced decide to switch to soybeans. That would equate to 3.4 million fewer acres of corn, or about 600 million bushels less production. That is not $5 corn — and maybe not even $5.50 — as carryover drops to 1.4 billion bushels. If those acres go to soybeans, it means 180 million bushels more, or a carryout of 520 million bushels. That’s bearish by any calculation.
What should jump out at you about the above calculations is that acres are way more important to corn than yield and vice versa for soybeans. A million more acres of corn is equal to 183 million bushels; a million more acres of soybeans is only 53 million bushels of production.
Do the math! The market can afford a 2-million-acre drop in corn, or 360 million bushels, depending on where. Assuming the drop in acreage is in the South where yields are not 240 bpa like they are in Illinois and Iowa, the result might be only 320 mb less production, taking carryout to 1.742 bb. That’s better but still not the $5 average for 2026-27.
UPSHOT. If you haven’t figured it out yet, the implications are huge going forward, with planting weather perhaps more important this year than it was last year. It is already wetter on the surface in the Midwest east of the Mississippi than it was last year. That and the June 30 revised acreage report will dictate. The surge in the KC version of wheat futures on Tuesday should shout loudly regarding acreages.
The false analysis of the importance of crude oil versus corn that I mentioned at the beginning of this week’s column, in my opinion, was overstated and ignored what was/is really going on — maybe by design? If you need help navigating these uncharted waters, including the ridiculous “accumulator contracting schemes” designed to be too good to be true for the troubled, give us a shout at info@gulkegroup.com or call Jamie at 707-365-0601. Maybe we can help.
Jerry Gulke can be reached at (707) 365-0601 or by email at Jerry@gulkegroup.com
(c) Copyright 2026 DTN, LLC. All rights reserved.